
Blog - Data Is Life
The personal blog of Roger Filmyer, focusing on the interaction between policy and data analysis/statistics.
On the Huggingface Breach
In July of 2026, the AI/ML model repository HuggingFace was unintentionally breached by an OpenAI-operated agent. My grandmother sent me a link to the New York Times article and I wrote my thoughts in an email to the family. I haven’t been putting much on my blog recently, so I figured I’d repost, with minor edits, my thoughts from last week:
The HuggingFace breach was the story of the week in my industry! Some thoughts:
Strava Heatmaps in Haiti
Last November, Strava released a feature called the Global Heatmap on their labs page. This weekend, a number of security analysts used this map to show the importance of military device security. When focused on countries like Djibouti, Syria, or Somalia, the map clearly shows Western military outposts that might otherwise be nondescript airstrips, near-impossible to find in vast desert expanses…
Payroll employment rises by 280,000 in May; unemployment rate essentially unchanged (5.5%) http://t.co/1Y9cSWJUIB #JobsReport #BLSdata
— BLS-Labor Statistics (@BLS_gov) June 5, 2015
Swing and a miss! But this time it’s a surprise in the opposite direction - I was 80,000 jobs too short.
Here’s what the distribution of guesses looked like for this month’s go-around:
#NFPGuesses Preview
Tomorrow will be the first Friday of the month, when the Bureau of Labor Statistics releases its employment numbers (called the Non Farm Payroll numbers). For twitter-addicted finance and economist types, this spawns a monthly ritual, #NFPGuesses, where people publicly post their guess for the month and see who can “nail the number”.
For the past four months, I’ve been collecting every #NFPGuesses tweet in anticipation of collecting them and analyzing them. Over the past two weeks, I’ve learned an entirely new statistical package (Pandas for Python) and made a very simple, yet elegant and reusable tool to quickly extract and clean my tweets.
Fool Millions Into Eating Chocolate With This One Weird Trick!
Yesterday, John Bohannon of io9 posted an article, “I Fooled Millions Into Thinking Chocolate Helps Weight Loss. Here’s How.”, that went absolutely viral. Bohannon ran an expose on the pervasiveness of bad nutritional science and bad nutritional science reporting by creating his own bogus study. It’s a fascinating read showing how the system breaks down if you can get through a few initial barriers. But I wanted to talk specifically about p-hacking, about what John & Co. did to get to 0.05 and out the door:
Gun Control and Gun Violence, Part 2
After my first go-around looking at the connection between gun control and gun violence, I decided to revisit this question with a more detailed dataset. Before, I was using the FBI’s Uniform Crime Report statistics, which cover eight major crimes across almost every police jurisdiction in the United States. This time, I looked at the National Incident-Based Reporting System, which is much more comprehensive; documenting every incident reported by participating jurisdictions and including time, place, crime, weapon used, characteristics of the suspect and victim, and much more information. A problem with the UCR is that data does not include weapon used- I couldn’t tell if a criminal in Florida had used a gun or just a banana to rob their victim.
How Margarine is Tearing New England Families Apart
(Spoiler: It’s not. Despite a very strong correlation)
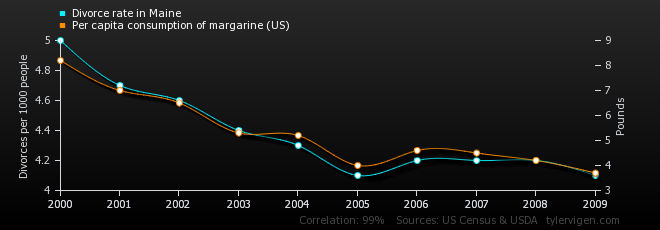
Source: Spurious Correlations at tylervigen.com
When I was in my Econometrics class at college, my professor Dr. Khemraj drilled into me the “Ten Commandments of Applied Econometrics”, from an influential paper of the same name by Peter Kennedy. These rules apply as much to econometrics as they do any statistical modelling exercise:
Thou shalt use common sense in economic theory. The “Common Sense” that Kennedy (and by extension, Professor Khemraj) talks about is truly basic methodology. Things like mixing up stock and flow variables (eg confusing wealth/assets (stock) with income (flow)), or comparing a per capita figure with a total.
Diversity and Inequality
Last weekend, a post on Reddit’s linguistics subforum showing a was a big hit. This map used a metric called Greenberg’s Linguistic Diversity Index, which is the percent chance that two random inhabitants of a given country have two different mother tongues. States like largely-homogeneous South Korea and Haiti have low scores (0.003 and 0.000, respectively), while places like Tanzania and Papua New Guinea, where every village might speak a different language, have LDIs of 0.95 or higher.
How to import your iTunes library into R
If there’s anything that 23andMe, last.fm, Strava, or any of those countless facebook apps have shown us, it’s that we love analyzing our own data and discovering new things about ourselves. A great source of data is your iTunes library. If you’re anything like me, you listen to music constantly- at home, at work, or on the go. With iPods (and iPhones) having been popular for over a decade, iTunes could potentially have data on a significant portion of your life. Why not poke around it?
Trials and tribulations building Rstudio Server on a mac
I’ve been trying to get RStudio Server to build on my iMac all of yesterday. In my opinion, it’s the best IDE for R, and being able to run it on another computer remotely is icing on the cake. My Samsung Chromebook with crouton really doesn’t have the “oomph” to… well… do anything meaningful. But building has been anything but a trivial process, and I want to post here to document some pitfalls I’ve found myself running into… this isn’t a well-documented process.
Gun Control and Gun Violence
The United States has heard repeated calls for more gun control legislation in the wake of the Sandy Hook Elementary School shooting. Every day it seems there’s a new mass shooting, with dire implications for the state of our country. But these mass shootings are isolated events that have almost been tailor-made to provoke disproportionate media attention. The day-to-day assaults, kidnappings, and murders affect a lot more people.
Liberals claim that gun control makes places safer by making guns harder to obtain and be used illegally. Conservatives counterclaim that gun control makes communities more dangerous by eliminating a key method of self defense for law abiding citizens. Each side has their share of talking points. Liberals point to the high rates of gun-related deaths in the United States compared to other developed countries (a point used famously in Michael Moore’s Bowling for Columbine), and conservatives point to stories of self-defense by would-be victims of robberies, home invasion, domestic abuse, or other serious crimes. Although I fall on the liberal side of the spectrum, I would much rather take up a position supported by empirical evidence. So I asked the question: Do harsher or stricter gun laws affect crime?
Help Democratize Democracy!

A few days ago, I found a really cool project on Twitter called OpenElections, which is trying to create a master dataset of every certified election result in the US. It’s gotten a chunk of critical acclaim, including a grant from the Knight Foundation.
Unfortunately, the work isn’t easy. If you’re lucky, you’ll get an excel sheet. But often times you’ll get a bad-quality scan of an image like this…

Quantifying Land Constraints in Boom Cities
Condo construction in Brickell, Miami. southbeachcars on flickr
A few weeks ago, Stephen Smith (who runs Market Urbanism) was comparing the fates of Miami and Vancouver, two cities that have experienced massive housing construction booms. Both cities have grown tremendously… and grown upward. This comes in the face of major land constraints- the Everglades for Miami, and the Cascade Mountains for Vancouver. But how much do these barriers actually impact development?