Gun Control and Gun Violence, Part 2
After my first go-around looking at the connection between gun control and gun violence, I decided to revisit this question with a more detailed dataset. Before, I was using the FBI’s Uniform Crime Report statistics, which cover eight major crimes across almost every police jurisdiction in the United States. This time, I looked at the National Incident-Based Reporting System, which is much more comprehensive; documenting every incident reported by participating jurisdictions and including time, place, crime, weapon used, characteristics of the suspect and victim, and much more information. A problem with the UCR is that data does not include weapon used- I couldn’t tell if a criminal in Florida had used a gun or just a banana to rob their victim.
Unlike the much simpler UCR dataset, I had quite a few difficulties getting the NIBRS files to do what I wanted. As you might expect, a comprehensive crime dataset for the United States was big. Really big. I was able to do my first analysis on a puny ARM-powered chromebook. I had to use my desktop to even be able to open the file, which was a tab-delimited ASCII file 6 gigabytes large. I normally use R to do quantitative analysis these days, but I had to load an open-source clone of SPSS to properly load the file and convert it. This isn’t even “Big Data” territory, and I still started running into performance issues. I started using dplyr to get its performance benefits, but a query on the entire database would still take me about 10-15 minutes to run, even with a Solid State Drive. This is where you learn about the importance of using a subset of your data as a test, because any typo you make stacks up quickly!
More discouraging was the fact that NIBRS is not universal. Now, UCR is a voluntary system, but still covers 98% of all Americans. The NIBRS only covers 30% (mostly broken up by state), and doesn’t include crimes from the seven biggest states. Look at the coverage map below:
(data from a JRSA report)
Fortunately, there is data available on the proportion of crime in and out of the database (the numbers above reflect the percent of crime covered in NIBRS for each state), so it is possible to normalize this data somewhat, but the lack of data for many parts of the country may make a definitive analysis difficult.
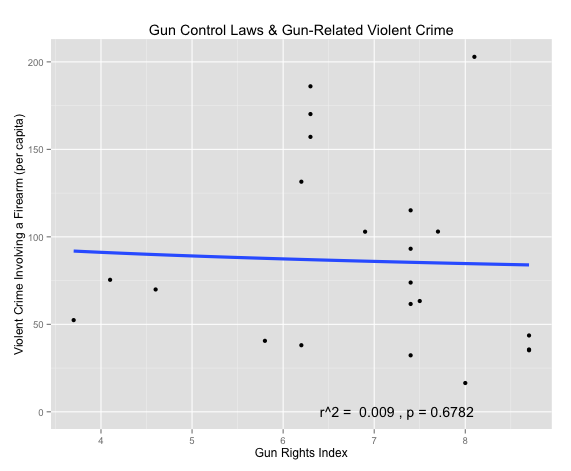
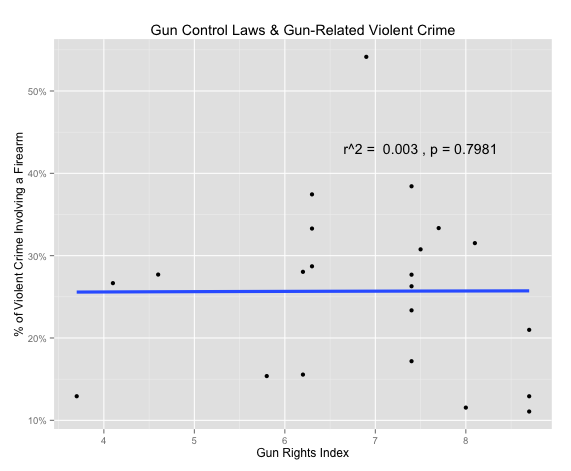
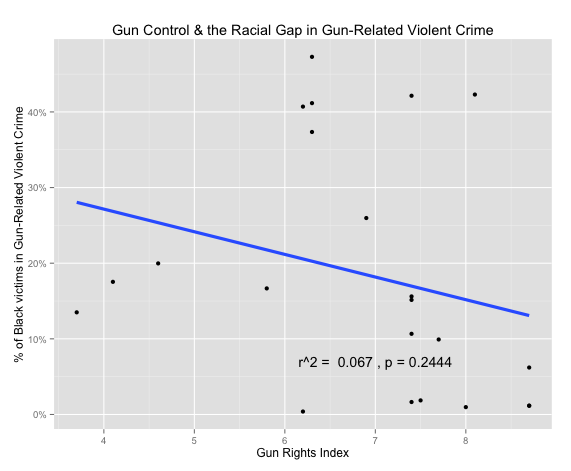
Even with a more detailed dataset, I wasn’t able to find any connection between gun laws and crime. Even controlling for things like crime rates (is a higher percentage of crime gun-related violent crime?), or a disproportionate effect on victims of color, I saw no impact.


Where I did see a big difference was (oddly) with population size. The bigger the state’s population, the more often violent crime tended to involve a gun. The trend was twice as strong for overall population than for just urban population. Population density had no impact.

In order to get good enough quality data, I cut out any state that did not report at least half of its total crime. As you can see in the map, that leaves only a smattering of state agencies, and even fewer cities. The strong correlation between population and crime ratios may be an artifact of two of the largest states (Ohio and Michigan) being home to a number of poor rust belt cities, while many of the smaller states are not in the traditionally poor deep south.
I’d be interested in seeing the impact as more police agencies sign on to NIBRS and open their case data to the public. A larger source of crime data would revolutionize criminology and sociology, and make it easier to understand trends like this. In the meantime, I’m going to have to say the jury’s still firmly out on gun control.
