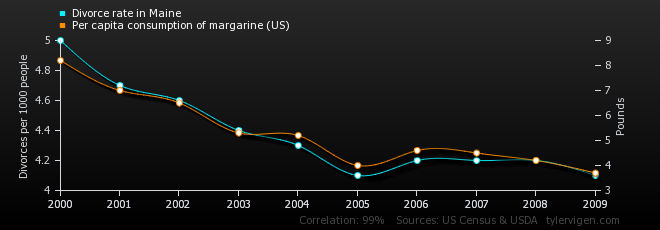
How Margarine is Tearing New England Families Apart
(Spoiler: It’s not. Despite a very strong correlation)

Source: Spurious Correlations at tylervigen.com
When I was in my Econometrics class at college, my professor Dr. Khemraj drilled into me the “Ten Commandments of Applied Econometrics”, from an influential paper of the same name by Peter Kennedy. These rules apply as much to econometrics as they do any statistical modelling exercise:
-
Thou shalt use common sense in economic theory. The “Common Sense” that Kennedy (and by extension, Professor Khemraj) talks about is truly basic methodology. Things like mixing up stock and flow variables (eg confusing wealth/assets (stock) with income (flow)), or comparing a per capita figure with a total.
-
Thou shalt ask the right questions. If you walk into an analysis blindfolded, the results might not look too good when you turn the lights back on. Make sure you truly understand the question that you’re asking.
-
Thou shalt know the context - do not perform ignorant statistical analysis. You should always know how your data came to be and how that might influence your results. If you’re looking at vacation days across the developed world, remember that Brits count paid holidays in vacation time while Americans do not. If you’re analyzing vote totals for municipal candidates across the US, remember that candidates in New York and Minnesota can stand for multiple parties. What was the wording on the survey that you’re basing your analysis off of? How did each of your record labels classify their artists' genres?
-
Thou shalt inspect the data. These days it’s incredibly easy to just type
summary(lm(dataset, formula = a ~ b))into an r prompt, see a significant result, copy the coefficient, and declare victory. It’s also incredibly easy to take a closer look at your data. At least plot out what your data looks like; humans are visual creatures and it’s much easier to see something absurd if you visualize it properly. -
Thou shalt not worship complexity. The simpler your model is, the easier it’s going to be to tell if you have a bad/misspecified variable, the less demanding it will be on your data, the more likely it is that you will be able to replicate your findings in the future.
-
Thou shalt look long and hard at thine results. When you find something, look at your results and make sure that they are sane. Make sure that everything’s going the right way (i.e. your coefficients are properly positive or negative); that the right things are significant, and that the overall conclusion is sane. You don’t want to produce a report only to find out that you transposed two of your variables!
-
Thou shalt beware of the cost of data mining. With a firehose of data at our fingertips, it’s tempting to just plug ‘n’ chug, blindly regressing things against each other and seeing what fits. This rarely ends well. Congratulations, you just discovered a random correlation that just happens to only fit your dataset perfectly. Your results are often bunk and evaporate as soon as more data becomes available.
-
Thou shalt be willing to compromise. Unfortunately for economists, statisticians, and data analysts everywhere, we live in the real world; not a neatly-defined model. Your data will not be perfect, and it is your responsibility to work with what you have; not to cross your arms and hold out for that “perfect special dataset”. Like in real life, there is no Mr./Mrs. Right. It is up to you to work with the conditions that you have, and understand the implications, to deliver as good a result as you can.
-
Thou shalt not confuse significance with substance. Just because a result is significant, does not mean it actually means anything. With enough data points; you’d be surprised at how much can magically become statistically significant. It’s as important to look at coefficients and effect sizes to understand if the relationship is worthwhile.
-
Thou shall confess in the presence of sensitivity. One of Nate Silver of 538’s favorite hobbies is to eat up overfitted political models. If your model relies on a small leap of faith in your variable specification, be responsible and make sure that’s disclosed. Otherwise you could end up with egg on your face.
With those in mind, let’s go back to the connection between margarine consumption and divorce rates in Maine. This is from “Spurious Correlations”, an excellent demonstration of the dangers of blindly trusting your preferred statistic above common sense. The website pulls a number of data feeds from public and private-sector data sources from a ten-year period (‘00-‘09), and picks out the strongest correlations between them. Thus you dig up alarming “conclusions” about Nicholas Cage Film Appearances, [Oil imports from Norway], or American sour cream consumption. Of course, all of these connections are absurd, merely drawn from finding the biggest coincidences in a suitably large time series dataset.
In conclusion, be responsible when using statistics, or you could end up a sworn enemy to the American margarine industry from your faulty analysis on American marriages.
